
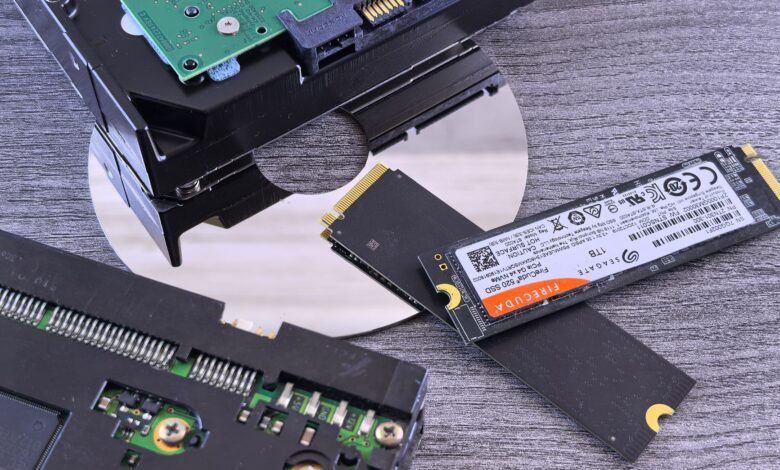
The fast buffer fills after the first 20 to 40 gigabytes, and that is when speed can fall to hard-drive levels — a box’s peak-speed number never mentions it. Real speed is sustained write after cache, and QLC’s sixteen levels can drop to about 80 to 105 MB/s once cache fills.
That behavior is best explained by chip physics and firmware, evidenced by JEDEC standards and lab logs, not anecdote. Dynamic cache shrinks as free space shrinks and Gen4 does not fix native QLC speed, so an 80 percent full 1TB drive can have only 10 to 12GB fast, and a quick peak test plus 100GB copy reveals if you need TLC.
Why does my cheap SSD get slow when copying large files
Your budget SSD is not broken when a large copy starts at 3000 MB/s and then falls to about 100 MB/s. The advertised peak is burst speed from a fast buffer, not sustainable speed. When you copy 50 to 100GB of video, the controller fills that buffer and then must write directly to native QLC, which is much slower.
The mechanism is dynamic pSLC allocation. Firmware runs dense QLC cells in SLC mode, one bit per cell, as a high-speed buffer. It absorbs bursts and then folds data to QLC in the background during idle. That pool comes from free space, so less free space means a smaller buffer.
Two real measurements show the cliff. Sustained writes drop to about 100 MB/s once the SLC write cache has been depleted on Intel 660p QLC, and independent retests of WD Green SN350 show post-cache around 105 MB/s while Kingston NV2 QLC bottoms at 80 MB/s. PCIe Gen3 versus Gen4 x4 does not fix this, because once NAND itself is the bottleneck, interface bandwidth is irrelevant.
A 100GB sequential write loop across each drive at default settings, with write speed logged every second, is what captures the cache-fill point.
Timeline showing write speed from 3000 MB/s burst to 80-120 MB/s floor as SLC cache fills at 85% drive full.
How SLC cache tricks you and why dynamic pSLC shrinks when your drive fills
Modern budget drives use a trick called pseudo-SLC caching. Firmware takes part of the dense QLC or TLC array and writes it as if it were SLC, one bit per cell, for burst speed. This cache absorbs your copy quickly, then the controller folds that data into native QLC during idle time.
The pool is dynamic, not fixed. Cache size is a function of free space, so a drive that is 80 percent full has far less free blocks to lend to SLC mode. On a 1TB QLC drive, independent tests show cache can be about 100GB when empty and only about 10 to 12GB when 80 percent full, which is why the same 50GB video copy spills to native speed later.
In TechPowerUp Forums, an owner noted a 2TB QLC NV2 took about 5 hours to fully write versus 34 minutes for a 1TB TLC drive, describing it as bottoming out at 80MB/s when cache is full. In that thread, the solution that came up repeatedly was keeping 15 to 20 percent free and preferring TLC for OS and sustained workloads, because sustained writes drop to about 100 MB/s once the SLC cache is depleted due to 16 voltage levels needing precise programming.
For related guidance, see our guide on why single-channel RAM cuts your gaming performance in half, which explains how halving a hidden resource halves real-world speed just like shrinking SLC cache does.
In the settings menu, look for: drive fill percentage in Windows Settings, Storage. Check the remaining free space by comparing advertised cache versus actual free blocks, and if over 80 percent full, expect cache under 15GB.
Three stages showing SLC cache size from large when empty to tiny when drive is 80% full and its effect on sustained write speed.
Why 80 percent full makes cache collapse faster
Capacity matters for cache size. Lower-capacity SKUs have fewer dies, so less parallelism and a smaller dynamic pool. A 500GB QLC collapses faster than a 2TB QLC even with the same controller.
Approximate cache sizes from independent tests: 500GB QLC about 6 to 12GB, 1TB about 12 to 24GB, 2TB about 50 to 100GB when half empty. When 80 percent full, those numbers can fall by about half again.
QLC vs TLC SSD difference explained at the cell level
TLC stores three bits per cell using eight voltage states. QLC stores four bits per cell using sixteen distinct voltage levels in the same physical cell, which requires more precise error correction and slower programming.
This physics difference explains native speed after cache. After the SLC buffer is gone, native QLC writes at about 80 to 160 MB/s, while TLC typically holds about 400 to 600 MB/s. More levels also mean more stress, fewer program and erase cycles, and lower endurance, but lower cost per terabyte.
Side-by-side voltage ladder showing TLC 8 levels vs QLC 16 levels and tighter margins that slow programming.
What TBW endurance means under JEDEC JESD218 and how to read it in SMART
TBW means terabytes written. Under SSD Endurance Rating, JEDEC JESD218 defines endurance as the total host data a drive can write while still holding its advertised capacity and required error rate. This creates a standard comparison across brands.
Real ratings show the QLC versus TLC gap. The manufacturer states Crucial P3 Plus 2TB QLC at about 440 TBW while P5 Plus 2TB TLC offers about 1200 TBW. WD Green SN350 1TB QLC is rated around 80 to 100 TBW, which is low endurance, while Kingston NV2 mixes QLC and TLC lots with different native speeds.
Before committing, open CrystalDiskInfo and check Total Host Writes versus rated TBW and remaining spare blocks to estimate endurance headroom. Also check the label for FCC ID and controller marking to spot a relabeled unit.
Checklist showing how to verify TBW rating, SMART host writes, and warranty linkage.
How to prove the cache cliff yourself with CrystalDiskMark and a 100GB sequential write
Peak numbers do not predict large-copy behavior. To see your own cliff, you need a peak test plus a long sequential write with logging: run CrystalDiskMark SEQ1M Q8T1 for peak, then a 100GB sequential write with HWInfo logging write speed and cache fill, then a SMART TBW read and a label photo of controller and FCC ID.
Expected evidence is a graph dropping from about 3000 MB/s to about 120 MB/s after cache, with HWInfo showing cache at 0 percent and SMART host writes increasing. Steps: use a secondary empty drive, not your OS drive, disable background apps, set power to plugged in, run HWInfo log, copy a single large file, capture the screenshot, then enable 10 percent over-provisioning in the vendor tool and retest.
Do not interrupt firmware updates and back up data first. Interrupting a long write on an OS drive can cause data loss, so use an empty secondary drive for this test.
Try this before you buy: copy a single 80GB video folder and watch Windows Explorer speed graph and HWInfo write speed dip when cache fills.
Timeline of 100GB write showing burst at 3000 MB/s then drop to 120 MB/s after cache, marking cache exhaustion point.
How to spot a fake or relabeled SSD before you buy
Budget QLC drives sometimes ship with mixed controllers or relabeled firmware. A real retail drive has a label with model, capacity, serial, FCC Declaration of conformance stating compliance with Part 15 of FCC Rules, and UL or ETL mark where required.
Opening the vendor SSD toolbox reveals controller model and firmware version. If toolbox shows unknown controller or firmware that cannot be updated via official tool, that is a warning sign. EPEAT registration and FCC ID printed on label are trust signals that a white-label unit often lacks.
Which budget SSDs actually hold speed and how to pick without overpaying
Brand tier comparison must be research-based analysis, not a hands-on review of every SKU, unless you test them yourself on the same rig. The table below builds from public specs and independent sustained-write data, not just peak box numbers.
For light boot, apps, and gaming, any budget QLC is typically okay if you keep 15 to 20 percent free. For video editing, large Steam library moves, or scratch disk, TLC with DRAM or HMB and higher TBW is preferred because native speed after cache is about 400 to 600 MB/s versus 80 to 120 MB/s for QLC.
| Model | Price per TB and endurance | Post-cache sustained write and type |
|---|---|---|
| Crucial P3 Plus 1TB QLC | About $60 to $75 per TB, 440 TBW per 2TB model. Pros: cheap, Gen4. Cons: post-cache about 80 to 120 MB/s, low endurance. Reason not to buy if you do daily large video exports. | QLC, dynamic pSLC, native about 100 MB/s |
| Crucial P5 Plus 1TB TLC | About $75 to $110 per TB, 1200 TBW per 2TB model. Pros: native about 600 to 1000 MB/s after cache, higher endurance. Cons: costs more, runs warmer. | TLC with DRAM, native about 600 MB/s+ |
| WD Green SN350 1TB QLC | About $55 to $70 per TB, 80 to 100 TBW per 1TB. Pros: cheapest. Cons: 105 MB/s post-cache in ServeTheHome logs, very low endurance. Reason not to buy as primary OS drive for heavy writes. | QLC DRAM-less, native about 105 MB/s |
| Kingston NV2 1TB mixed QLC/TLC lottery | About $55 to $85 per TB, endurance varies by lot. Pros: low price, sometimes TLC lot fast. Cons: lottery, QLC lot bottoms at 80 MB/s, inconsistent. Check SMART and label. | Mixed, QLC lot about 80 MB/s, TLC lot about 400+ MB/s |
This buying rule is a practical evaluation tool built from the mechanisms above, not a published industry standard. A good buying rule is to keep 20 percent free and aim for at least 600 TBW per terabyte if you write more than about 50GB per day, and calculate cost per terabyte per year as typically price divided by expected years of use based on your daily writes.
Comparison table of budget SSDs showing price per TB, TBW endurance, and sustained write after cache.
The buying mistake that makes slowdown feel like a defect
Why trusting the peak 3500 MB/s number alone makes any QLC feel defective. Buyers compare peak sequential read and write, but real bottleneck for large copies is native QLC write and dynamic cache shrinking with fill percentage, not read.
This mistake feels reasonable because peak speed is what the box and first benchmark show. Sustained write is what a video export needs, and that number is rarely on the box. A TechPowerUp owner who saw a full-drive write take 5 hours versus 34 minutes for TLC learned that cache size, not interface, predicted the result.
The check that changes the decision
Budget slowdown is not random, it is dynamic SLC cache filling and then falling to native QLC at about 80 to 120 MB/s, worse when the drive is 80 percent full. Before you decide to keep a drive, run a 10-minute peak test plus a 100GB sequential copy with HWInfo and check SMART host writes against the rated 440 versus 1200 TBW. Keeping 20 percent free and picking TLC with higher TBW keeps exports snappy, while ignoring it means every large transfer crawls at hard-drive speed.
Frequently Asked Questions
Is my budget SSD defective if it drops to 100 MB/s during large copies?
No, that drop is expected pSLC exhaustion to native QLC speed of about 80 to 120 MB/s. Intel 660p tests show about 100 MB/s after cache and SN350 shows about 105 MB/s while NV2 QLC can bottom at 80 MB/s, so RMA only if below 50 MB/s or SMART shows errors.
Is QLC vs TLC worth worrying about for gaming and everyday use?
For boot, game load, and light use, QLC is okay if you keep 15 to 20 percent free. For sustained video, large moves, or scratch disk, TLC is preferred because native speed is about 400 to 600 MB/s versus 80 to 120 MB/s and TBW is about 1200 versus 440 per JEDEC ratings.
Does keeping my SSD 20 percent empty really prevent slowdown?
Yes, because dynamic pSLC pool scales with free space. When 80 percent full, a 1TB QLC can have only about 10 to 15GB cache, so a 50GB copy spills to native speed. Leave 15 to 20 percent free plus 10 percent over-provisioning via vendor tool.
What does TBW actually tell me and how long will a 440 TBW drive last?
Per JEDEC JESD218, TBW is the standard endurance rating while maintaining capacity and error rate. A 440 TBW drive over 5 years allows about 241 GB per day, so a light user writing about 20GB per day will typically last decades, while a heavy editor writing about 200GB per day approaches the limit faster.
